We use a transparent EBITDA (Earnings Before Interest, Taxes, Depreciation, and Amortization)-based static payback model focused on real cash recovery speed. With conservative, verifiable inputs—2.2 rentals/station/day, $2 ticket, 20% venue share, 3% gateway fee, and one-time software $7,500—the downloadable Excel returns ~200.9 days (~6.7 months). Scenarios within 12 months are preloaded.
- Download the ROI Calculator (Excel): [Click to Download] HeyCharge Power Bank ROI Calculator.xlsx
- New to the topic? Read the primer: Is the Power Bank Franchise Rental Business Profitable?
Table of Contents
- Part 1. Why payback is the real decision-maker?
- Part 2. Standardized model: inputs, outputs, and formulas (with beginner notes)
- Part 3. Scenario benchmarks: mall vs. restaurant vs. hotel
- Part 4. Sensitivity: utilization & revenue share drive payback the most
- Part 5. 8 practical ways to hit a within-12-months payback
- Part 6. FAQ
- Part 7. Next steps
Part 1. Why payback is the real decision-maker?
Payback dictates momentum and budgeting cadence. A fast and auditable metric enables operator confidence, smoother venue negotiations, and shorter internal approvals.
Our definition (clear & verifiable):
- Payback (days) = CAPEX ÷ Daily net operating profit
- Payback (months) = CAPEX ÷ Monthly EBITDA (Monthly EBITDA = daily net × 30)
- No chassis depreciation in the denominator. Battery packs are expensed per order via a per-order depreciation line.
For “thickness” of returns, pair payback (speed) with Annualized ROI or project IRR/NPV.
Part 2. Standardized model: inputs, outputs, and formulas (with beginner notes)
2.1 What to fill (green cells in the Excel “Inputs”)
Deployment & ticket
- Stations (qty) – e.g., 100
- Rentals per station per day – e.g., 2.2
- Revenue per rental – e.g., $2
Commercial terms
- Revenue share to supplier (%) – 0% in our OEM example
- Revenue share to outlets (%) – 20%
- Payment gateway fee (%) – 3%
Daily Opex (already daily)
- Daily labor cost – $68.97
- Daily SIM cost – $10.96
- Daily SMS cost – $1.50
- Per-order battery depreciation – $0.018/order
- Daily software maintenance – $5.48
One-time CAPEX
- Standard software (one-time) – $7,500
- Station unit cost – $355
- Logistics per station – $68
- Marketing – $0 (optional)

For operators, distributors, and venue partners, choosing the right supplier matters more than just comparing consumer-facing brand awareness.
2.2 What the sheet calculates
- Daily revenue = stations × rentals/station/day × ticket
- Revenue after share = revenue − supplier share − venue share − gateway fee
- Daily opex = labor + SIM + SMS + (per-order battery dep × total orders) + software maintenance
- Daily net operating profit (EBITDA-like) = revenue after share − daily opex
- Payback (days) = CAPEX ÷ daily net
- Monthly EBITDA = daily net × 30
- Static payback (months) = CAPEX ÷ monthly EBITDA
Default example baked into the Excel
- Daily revenue: 100 × 2.2 × $2 = $440
- Shares/fees: venue $88/day, gateway $13.2/day, supplier $0 → after-share $338.8/day
- Daily opex: labor 68.97 + SIM 10.96 + SMS 1.50 + battery dep (100×2.2×$0.018 ≈ 3.96) + software 5.48 = $90.87/day
- Net/day: $338.80 − $90.87 = $247.93
- CAPEX: $7,500 + 100 × ($355 + $68) = $49,800
- Payback: $49,800 ÷ $247.93 ≈ 200.9 days (~6.7 months)
Part 3. Scenario benchmarks: mall vs. restaurant vs. hotel
Use these as directional templates and validate locally in the Excel.
Mall (flagship) — conservative
- 2.2–2.4 rentals/station/day, $2–3 ticket; share 20–25%
- Often ~6–8 months, faster if share improves.
Restaurant street (cluster) — conservative
- 2.0–2.3 rentals/station/day; $2 ticket; share 22–28%
- Typically ~7–10 months, depending on visibility and staffing.
Hotel (steady premium) — conservative
- 2.0–2.2 rentals/station/day; room for $ upsell; share ~25%
- Frequently ~7–10 months, with upside on ticket.
Part 4. Sensitivity: utilization & revenue share drive payback the most
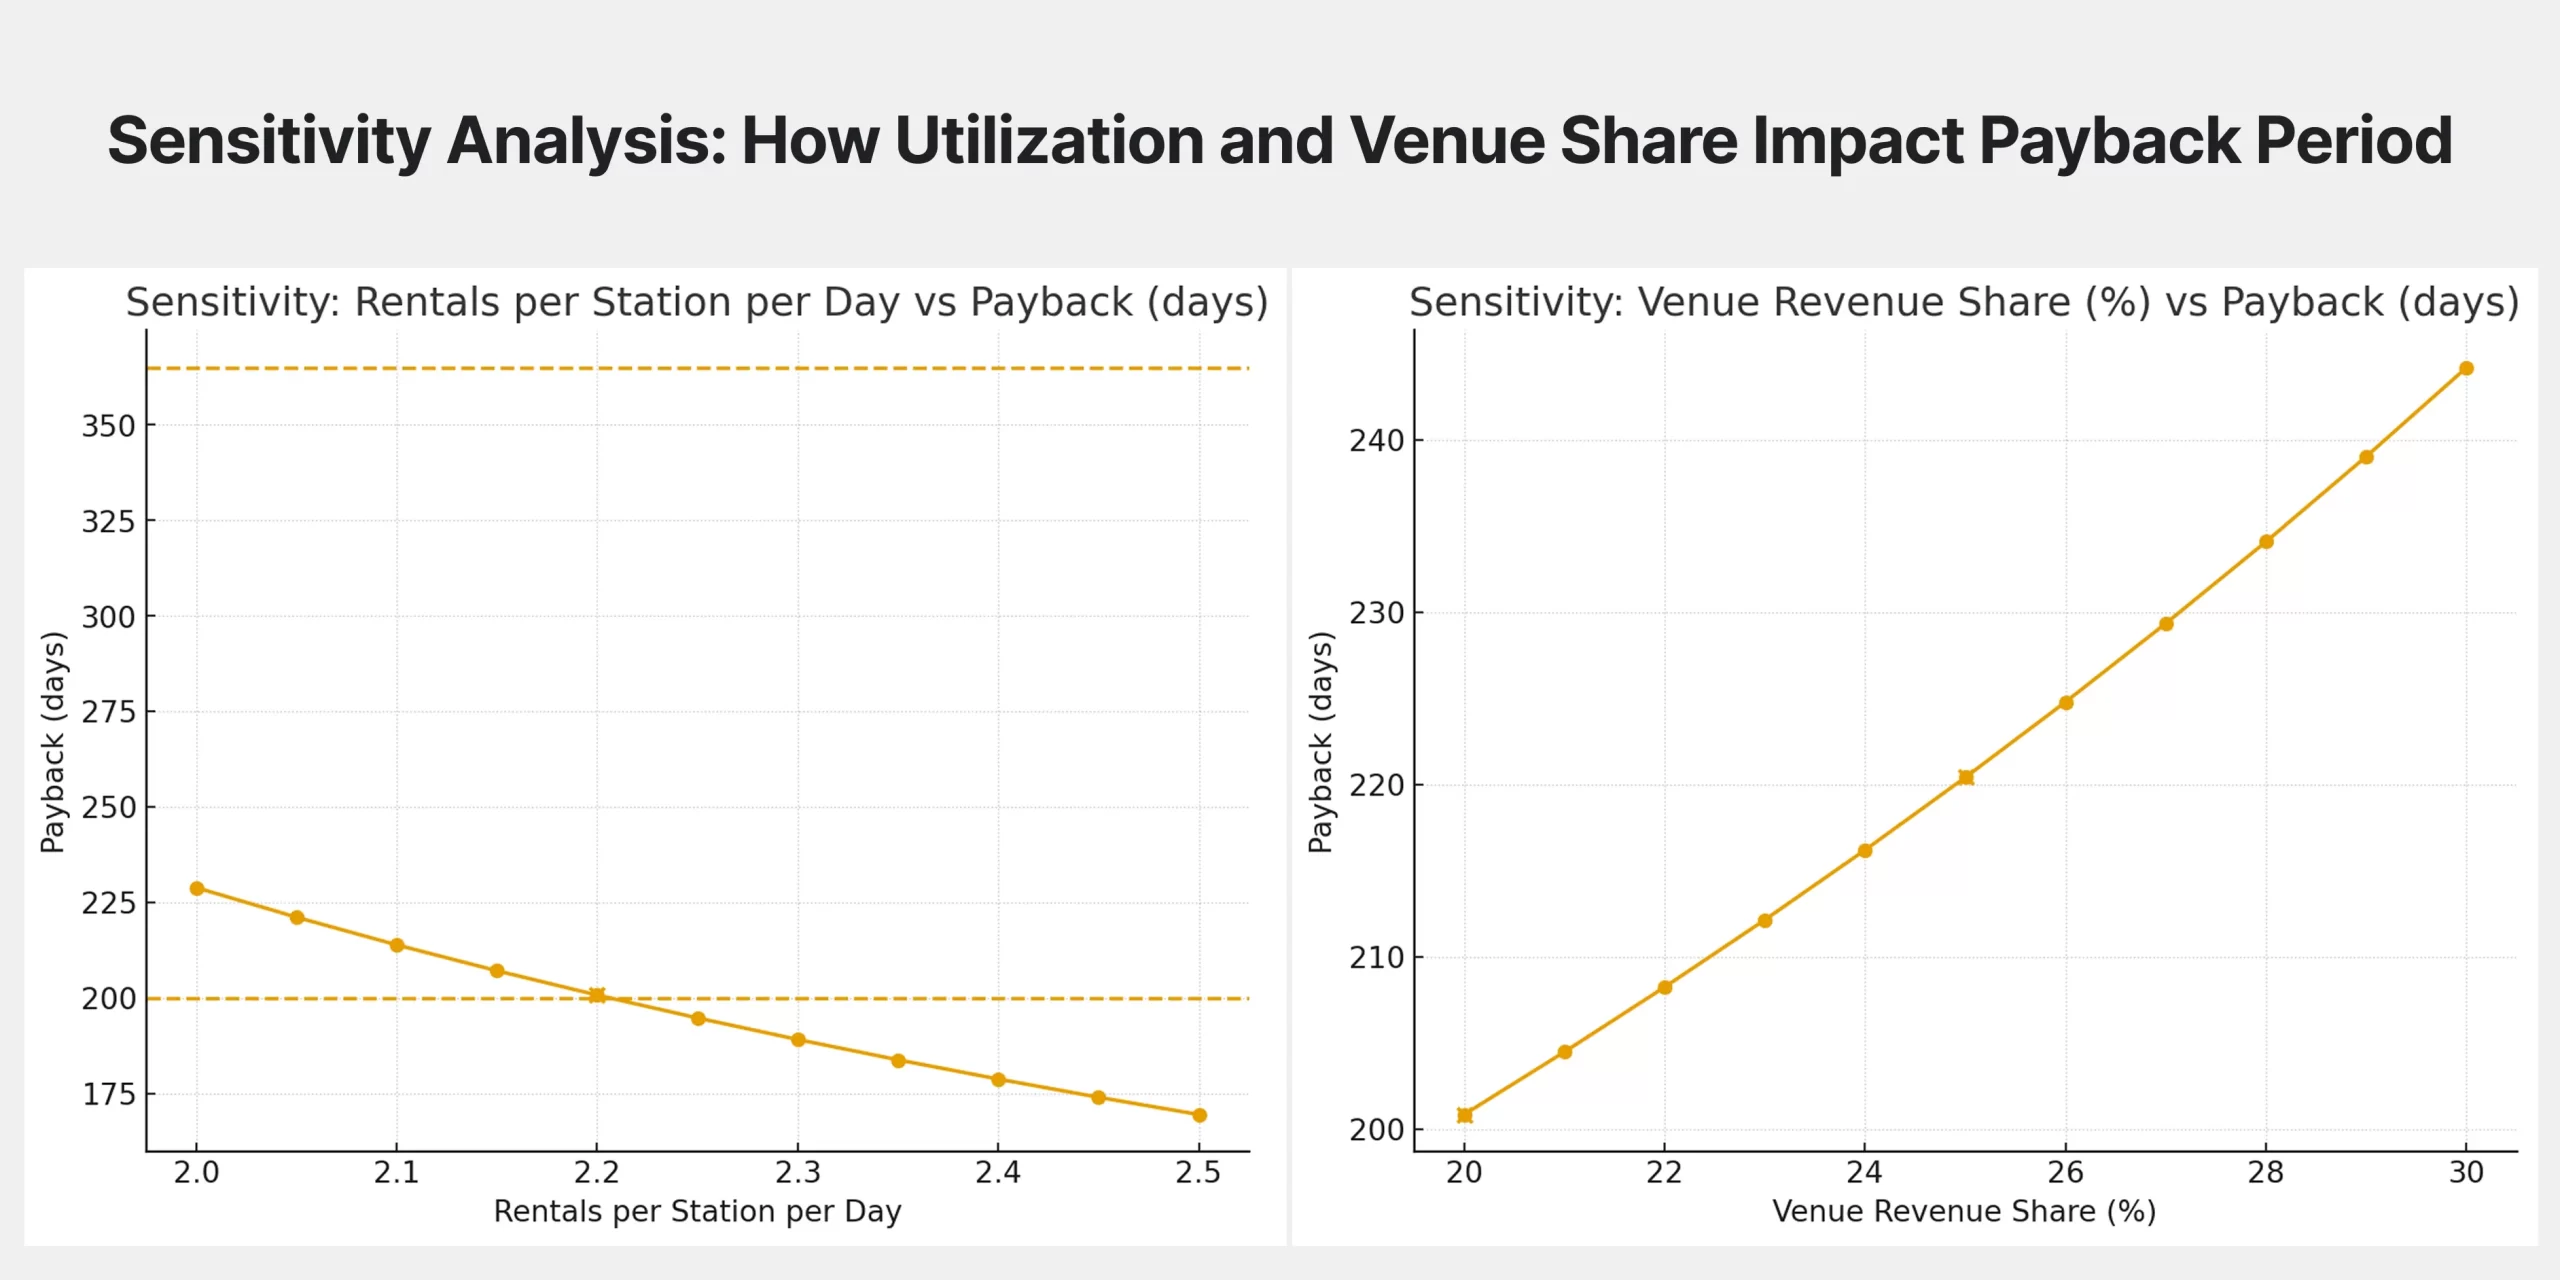
Two high-leverage dials:
- Rentals/station/day. In the 2.0–2.5 band, a +0.2 uplift can shave weeks off payback.
- Venue revenue share. Each −5pp (e.g., 25% → 20%) is equivalent to a notable utilization gain.
What to do
- In Excel, sweep rentals from 2.0 → 2.5; log payback days.
- Sweep venue share from 30% → 20%; use the graph in negotiations.
Part 5. 8 practical ways to hit a within-12-months payback
1. First-sight placement & signage: entries, queues, cashier lines—visibility converts.
2. Negotiate share with evidence: trade coverage + co-op media for a fair 25–30% venue share.
3. Simple pricing UX: unified start fee (e.g., $2) + venue-specific hourly tiers; AB test.
4. Availability discipline: remote monitoring + swift replenishment; you can’t monetize an empty slot.
5. Cluster selling: bundle ads across a mall corridor or F&B street to lift ads/device.
6. Optimize gateway economics: mix channels to stay near ~3% effective fee.
7. Right-sized fleet: enough density for ops and media leverage, but avoid over-deployment that dilutes rentals/station.
8. Monthly “under-performers” list: relocate, re-price, or upgrade placement.
Part 6. FAQ
Q1: What exactly do you mean by “payback within 12 months”?
It’s EBITDA-based static payback focused on cash recovery speed:
Payback (days) = CAPEX ÷ Daily net operating profit, where daily net ≈ revenue after venue share & gateway fees minus daily opex (labor, SIM, SMS, per-order battery depreciation, software maintenance). We exclude chassis depreciation because of the free-replacement policy; battery packs are expensed per order.
Q2: Which inputs move payback the most?
1. Rentals/station/day (utilization proxy),
2. Venue revenue share
3. Ticket price
4. Gateway fee. A −5pp venue-share improvement (e.g., 25% → 20%) can rival a +0.2 to +0.3 gain in rentals/station/day.
Q3: What’s the difference between payback and ROI/IRR?
Payback = recovery speed (cash focus).
ROI / IRR = return thickness and time value.
Use payback for market communication and deployment pacing; use ROI/IRR for investment committee decisions.
Part 7. Next steps
- Download the ROI Calculator (Excel): [Click to Download] HeyCharge Power Bank ROI Calculator.xlsx
- Validate your venues: change rentals/station/day, venue share, and gateway fee first.
- Read the primer: Is the Power Bank Franchise Rental Business Profitable?
- Talk to us: want a 1:1 ROI walkthrough with your site data? Feel free to contact to us!