In the rapidly evolving shared power bank industry, choosing the right operational model can make or break a business’s success and profitability. As of 2025, the global shared power bank market is valued at approximately USD 2-6.5 billion, with projections for strong growth at a CAGR of 15-18% through 2033, driven by increasing mobile device usage and urbanization. China remains the dominant player, with its market size exceeding CNY 160 billion (approximately USD 22.8 billion) and an expected annual growth of about 28%, boasting over 5.4 million online devices nationwide. However, similar trends are emerging in Europe, North America, and Southeast Asia, where urban mobility and on-the-go charging demands are fueling expansion. Despite this growth, the industry faces pressures from rising costs and fierce competition. Early strategies favored direct operations, but there’s a shift toward franchise models, which now account for over 70% of operations in mature markets like China, aiming for cost efficiency and scalability. This article compares franchise (agency) and direct (company-owned) models, analyzes their profitability, and offers strategies to help operators—whether in Asia, Europe, or the Americas—make informed decisions and avoid common pitfalls.
Table of Contents
- Part 1. Direct Model: Advantages, Drawbacks, and Profit Analysis
- Part 2. Franchise Model: Advantages, Drawbacks, and Profit Analysis
- Part 3. Franchise vs. Direct: Profit Comparison, Data, and Risk Assessment
- Part 4. Selection Strategies: Tailoring to Your Context
- Conclusion: Smart Choices for Sustainable Profits
Part 1. Direct Model: Advantages, Drawbacks, and Profit Analysis
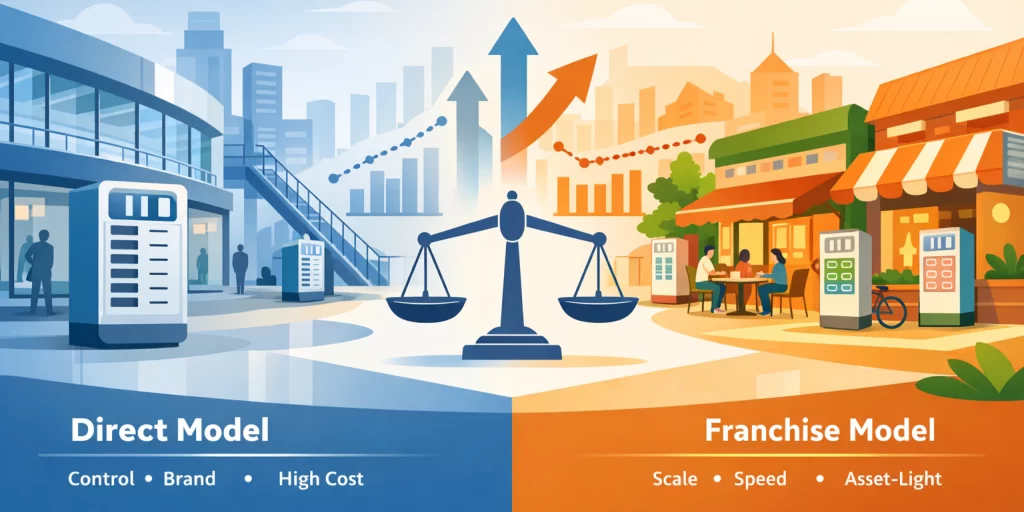
The direct model involves the platform directly managing locations, equipment, and teams, maintaining full control over the operational chain. This approach is common in early-stage markets or regions with strict regulations, such as parts of Europe and the US, where brand consistency is prioritized.
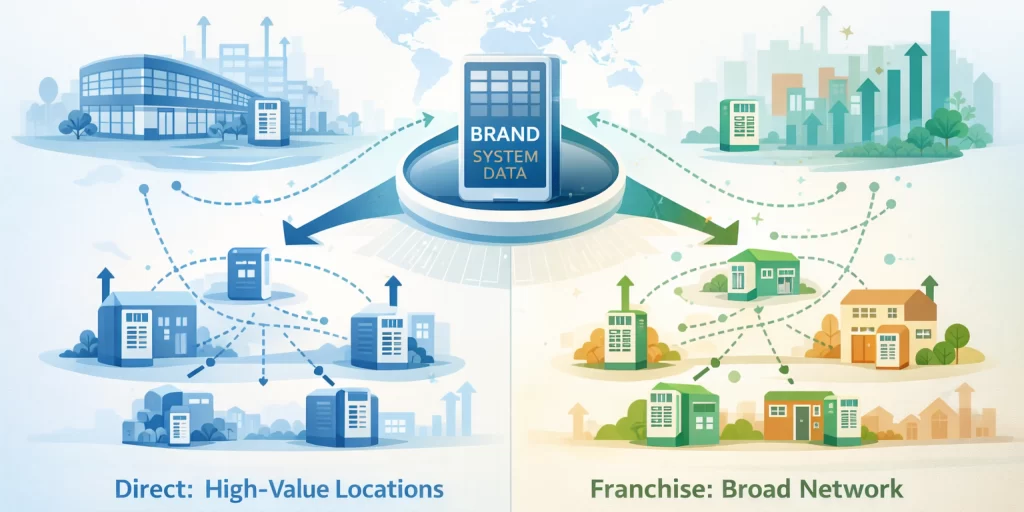
Advantages: Strong brand control ensures standardized service and superior user experience. It’s ideal for high-value locations like urban malls in major cities (e.g., New York or London equivalents), facilitating unified data management and user journey optimization. Globally, this model supports long-term branding and innovation, reducing inconsistencies seen in franchised setups.
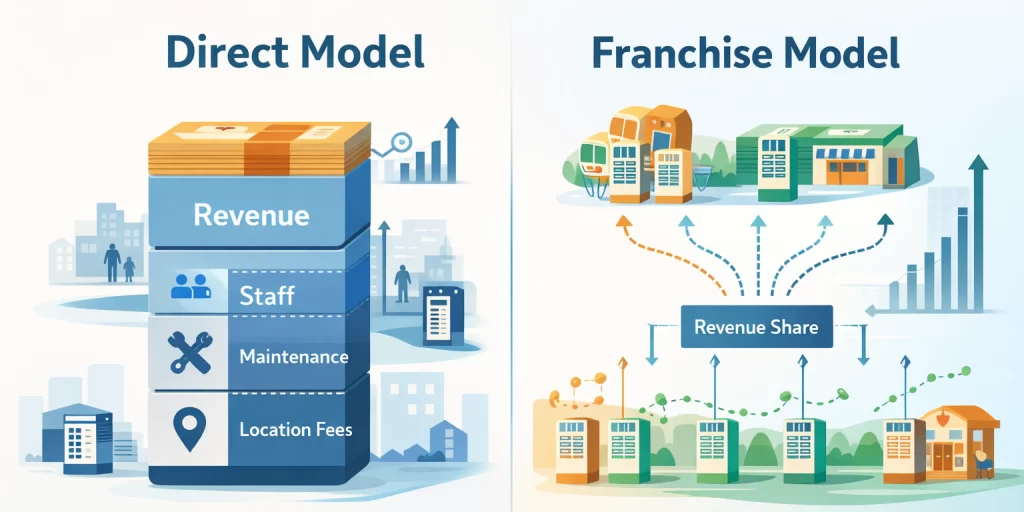
Drawbacks: As a capital-intensive model, it incurs high costs for personnel, incentives, and maintenance—often accounting for up to 90% of total expenses. Expansion is slower, and external factors like economic downturns or pandemics can amplify pressures. In emerging global markets, covering rural or low-density areas becomes challenging, leading to resource inefficiencies.
Profit Analysis: Profit margins hover around 24.85%, with full revenue recognition, but revenue dips sharply if locations are reduced. In China, a leading brand initially relied on direct operations, resulting in ballooning costs from large business development teams, prompting a pivot to hybrids. This model suits well-funded large operators globally, offering stable returns but with longer payback periods (typically 6-12 months). In the US or Europe, where labor costs are higher, profitability may be lower without scale.
Part 2. Franchise Model: Advantages, Drawbacks, and Profit Analysis
The franchise model delegates location management and daily operations to agents or partners, with the platform providing equipment, backend support, and supply chain services. Revenue comes mainly from revenue shares or franchise fees. This has become the global mainstream, comprising 70-90% of operations in Asia and gaining traction in Western markets for rapid scaling.
Advantages: Its asset-light nature enables quick expansion, shifting risks to franchisees and allowing platforms to recover funds while cutting operational costs. It’s particularly effective in underserved markets, like suburban areas in the US or emerging cities in Southeast Asia. In 2025, many platforms have achieved network partner ratios of 89.2% through franchising, boosting scale efficiently.
Drawbacks: Decentralized pricing can lead to inconsistencies, such as rental fees varying from USD 0.50 to several dollars per hour across locations, increasing user complaints. Brand maintenance is tougher, with franchisees facing high pressure from 10-30% revenue shares, potentially leading to shortcuts like unauthorized fee changes or equipment swaps. In international contexts, cultural or regulatory differences (e.g., EU data privacy laws) can exacerbate these issues.
Profit Analysis: Margins range from 11-17.8%, lower than direct but with higher revenue proportions, helping platforms turn profitable. A major Chinese brand saw franchise revenue hit 70.7%, but disputes remain a risk. Payback is quicker, ideal for startups scaling globally, though additional costs like battery recycling can mount in eco-conscious regions like Europe.
Part 3. Franchise vs. Direct: Profit Comparison, Data, and Risk Assessment
To provide a clear global perspective, here’s a comparison across key dimensions, drawing from 2025 industry reports. Note that while data is heavily influenced by China’s mature market, similar dynamics apply worldwide, adjusted for local costs and regulations.
| Dimension | Direct Model | Franchise Model |
|---|---|---|
| Cost Structure | High (operations ~90% of costs, including staff and upkeep) | Low (via 0.05-1% shares; weaker central ad monetization) |
| Expansion Speed | Slow (capital-heavy limits) | Fast (asset-light, penetrates underserved areas) |
| Profit Margin | ~24.85% (full revenue capture) | 11-17.8% (share-driven) |
| Risk Level | Medium (vulnerable to external shocks like post-pandemic shifts in user behavior) | High (pricing inconsistencies, higher complaints) |
Overall, the franchise model fuels growth—the 2023 Chinese market hit CNY 126 billion (about USD 18 billion), up 25.7%—but profitability gains are modest. Globally, with the market at USD 1.5-6.5 billion in 2025, franchises drive efficiency but require robust oversight. Risks: Direct models falter under macro pressures, while franchises risk reputational damage. A hybrid (e.g., 70:30 direct-to-franchise ratio) balances strengths, as seen in successful Asian transitions.
Part 4. Selection Strategies: Tailoring to Your Context
Choosing a model depends on your scale, market, and resources. Small operators in growing regions like North America might favor franchises for low entry barriers, while large firms in Europe could opt for direct to leverage brand control.
Practical Tips:
- Start with direct in a few high-value spots to test and refine, then franchise for broader reach. Use data analytics to forecast demand and minimize idle assets.
- Embrace hybrids: Direct for branding and innovation, franchises for coverage—common in global leaders.
- Risk Mitigation: Craft solid franchise agreements, incorporate insurance for damages, and comply with local regs (e.g., US consumer protection or EU sustainability standards).
- Future Outlook: From 2025-2030, franchises will reshape profits via user enhancements (contactless rentals) and diversified revenue like ads, countering price hikes that erode loyalty. A top Chinese brand’s shift to franchises cut costs but didn’t boost net profits significantly, underscoring the need for user retention focus—applicable worldwide.
Conclusion: Smart Choices for Sustainable Profits
Both models have merits, but success hinges on balancing growth and control. The shared power bank sector is promising yet challenging, with fine-tuned operations key to longevity. As markets mature globally, hybrids may dominate, integrating with electric mobility or smart cities. Assess your setup, and share your insights in the comments—let’s discuss thriving in 2025’s competitive landscape!